Live signals
Live signals: MQL5 Market, Myfxbook, Myfxbook Autotrade (offline: May 17, 2021)
Raw backtest results
The seller provides a very large number of setfiles on his own website. We have decided to make a small selection based on performance.
The backtest results can only be viewed properly on high resolution screens. Occurring various anomalies (e.g. missing ticks for specific time periods) in the backtest results were analyzed and removed with the Quant Analyzer 4 from StrategyQuant. Based on this analysis all further signal processing and statistical analysis were performed with Matlab from MathWorks.
Click on one of the tabs below to open the corresponding backtest.
-
NY CloseTrading AUDNZD M5
-
NY CloseTrading EURUSD M5
-
NY CloseTrading GBPUSD M5
-
NY CloseTrading USDCAD M5
-
NY CloseTrading USDCHF M5
-
NY CloseTrading USDCAD M5 (D)
-
Daily levels EURUSD M30 L1 (ATR)
-
Daily levels BTCUSD M30 L1 (ATR)
-
NY CloseTrading USDCHF M1
-
LondonOpen EURUSD M30
-
NY CloseTrading CHFJPY M5 (B)
-
Impulse Intraday BTCUSD M60
-
Impulse Intraday EURUSD M1 (60)
powered by Advanced iFrame. Get the Pro version on CodeCanyon.
powered by Advanced iFrame. Get the Pro version on CodeCanyon.
powered by Advanced iFrame. Get the Pro version on CodeCanyon.
powered by Advanced iFrame. Get the Pro version on CodeCanyon.
powered by Advanced iFrame. Get the Pro version on CodeCanyon.
powered by Advanced iFrame. Get the Pro version on CodeCanyon.
powered by Advanced iFrame. Get the Pro version on CodeCanyon.
powered by Advanced iFrame. Get the Pro version on CodeCanyon.
powered by Advanced iFrame. Get the Pro version on CodeCanyon.
powered by Advanced iFrame. Get the Pro version on CodeCanyon.
powered by Advanced iFrame. Get the Pro version on CodeCanyon.
powered by Advanced iFrame. Get the Pro version on CodeCanyon.
powered by Advanced iFrame. Get the Pro version on CodeCanyon.
Statistical analysis
| Setfile | Sortino Ratio | Downside Deviation | Independence Factor |
|---|---|---|---|
| 0-Limit[MR][PCh][v1.900][NY_CloseTrading]_AUDNZD_M5 | 1.22 | 1.15 | 1 |
| 0-Limit[MR][PCh][v1.900][NY_CloseTrading]_EURUSD_M5 | 0.49 | 2.36 | 1 |
| 0-Limit[MR][PCh][v1.900][NY_CloseTrading]_GBPUSD_M5 | 1.63 | 1.78 | 1 |
| 0-Limit[MR][PCh][v1.900][NY_CloseTrading]_USDCAD_M5 | 0.97 | 0.9 | 0.54 |
| 0-Limit[MR][PCh][v1.900][NY_CloseTrading]_USDCHF_M5 | 1.41 | 0.75 | 1 |
| 0-Limit[MR][PCh][v1.999][NY_CloseTrading]_USDCAD_M5_(D) | 0.6 | 1.19 | 0.54 |
| 1-Stop[BR][PCh][v1.778][Daily_levels]_EURUSD_M30_L1_(ATR) | 0.62 | 3.6 | 1 |
| 1-Stop[BR][PCh][v1.818][Daily_levels]_BTCUSD_M30_L1_(ATR) | 0.76 | 1.52 | 1 |
| 2-Market[MR][PCh][v1.778][NY_CloseTrading]_USDCHF_M1 | 0.57 | 0.89 | 1 |
| 2-Market[MR][PCh][v1.787][LondonOpen]_EURUSD_M30 | 0.62 | 1.96 | 1 |
| 2-Market[MR][PCh][v1.900][NY_CloseTrading]_CHFJPY_M5_(B) | 0.75 | 1.74 | 1 |
| 3-Market[M][PA][v1.818][Impulse_Intraday]_BTCUSD_M60 | 3.63 | 1.41 | 1 |
| 3-Market[M][PA][v1.900][Impulse_Intraday]_EURUSD_M1_(60) | 1.63 | 2.43 | 1 |
Single setfiles / strategies
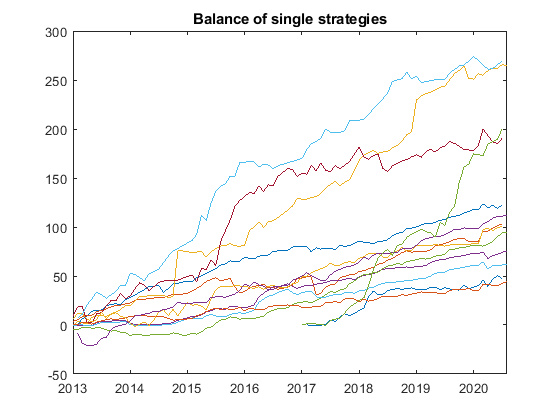
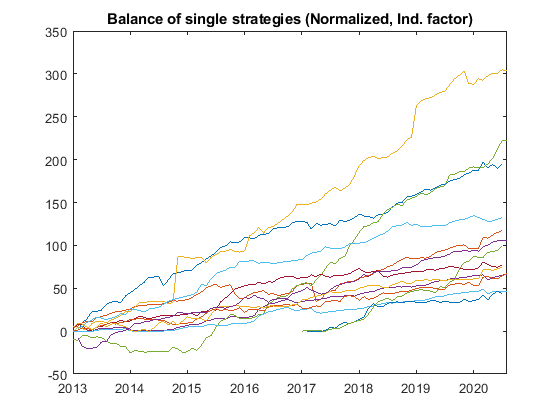
The two following figures show the single setfile or strategy results with unchanged performance results (left) and results modified taking into account the risk and independence factor (right). Due to the normalization the final balances in the right curve are irrelevant, what counts is that the balance sheets with higher risk and higher correlation are weighted lower.


Portfolio with all setfiles / strategies
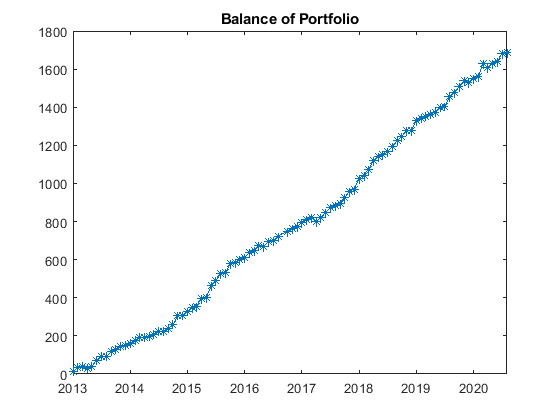
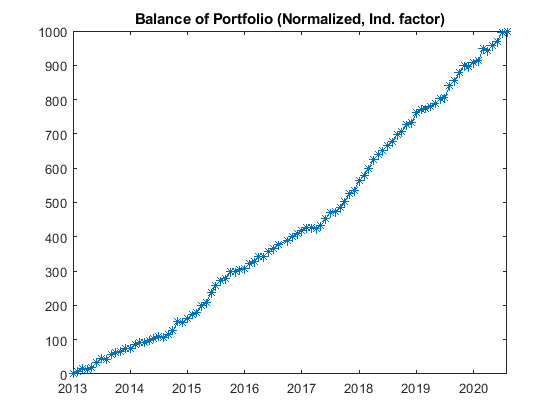
The two following figures show the portfolio balance with unchanged performance results (left) and results modified taking into account the risk and independence factor (right). Due to the normalization the final balance of the right curve is irrelevant, what counts are the slightly smoother curve and the statistics.


Final statistical results of the portfolio
The factors show significant improvements by weighting each strategy. Very striking is the Sortino ratio, which increases by about 120%.
| Portfolio related factors (on monthly basis) | Unweighted | Weighted | Improvement |
|---|---|---|---|
| Sortino ratio | 5.0112 | 11.0886 | 121.3 % |
| Return/Drawdown ratio | 53.2876 | 73.139 | 37.3 % |
| Calmar ratio | 0.58558 | 0.80373 | 37.3 % |
Weighted: Downside Deviation and Independence factor


